


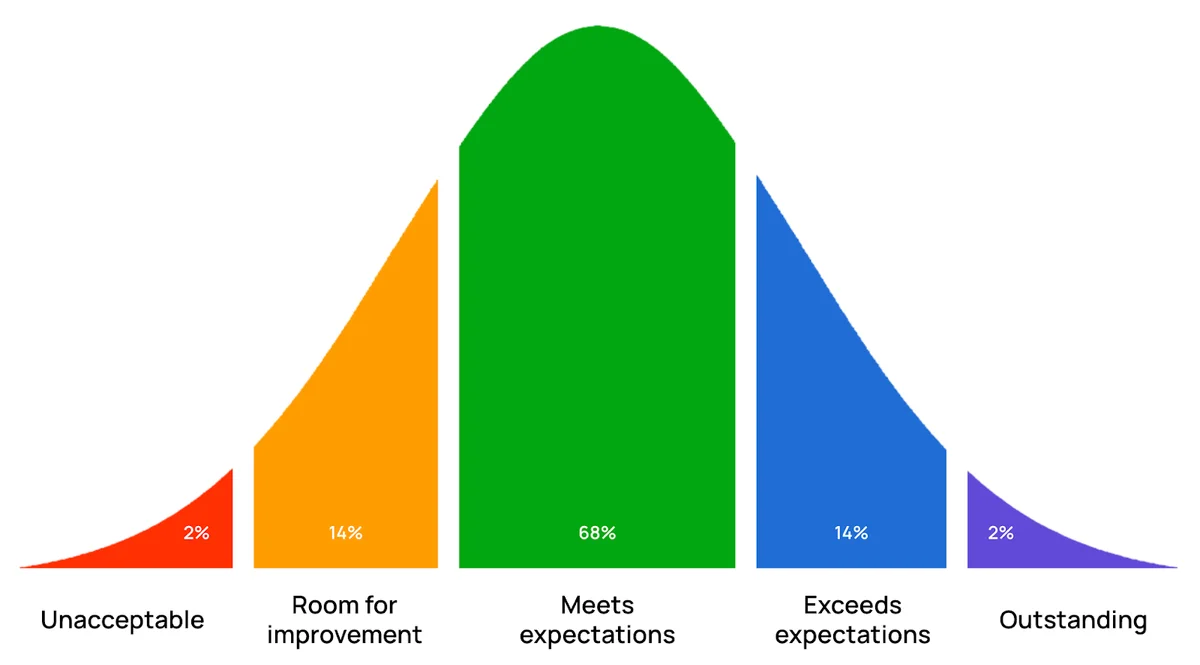
When companies run performance reviews, they produce a bell curve of manager ratings.
This bell curve, known as a “normal distribution”, shows most employees as average, or “Meeting expectations.” A smaller number of employees fall to the left or right. They may get a “Needs Improvement” rating, making them candidates to be exited from the company. Others may be “Exceeding expectations.” They’re more likely to get promotions and rewards.
Bell curves are what you get when you measure additive variables. These are variables that don’t affect one another, like height, or IQ. In the early days of performance reviews, a bell curve made a lot of sense. Work was solitary and repetitive.

But today’s work is different. It happens in networks, using tools like Slack, Teams, and Zoom. It’s collaborative and creative. Does a bell curve still make sense?
Talent follows a power law (And Why 9-Box Grids Capture It Better)
There’s a secret about talent management that HR doesn’t understand, but academic researchers do: talent follows a power law.
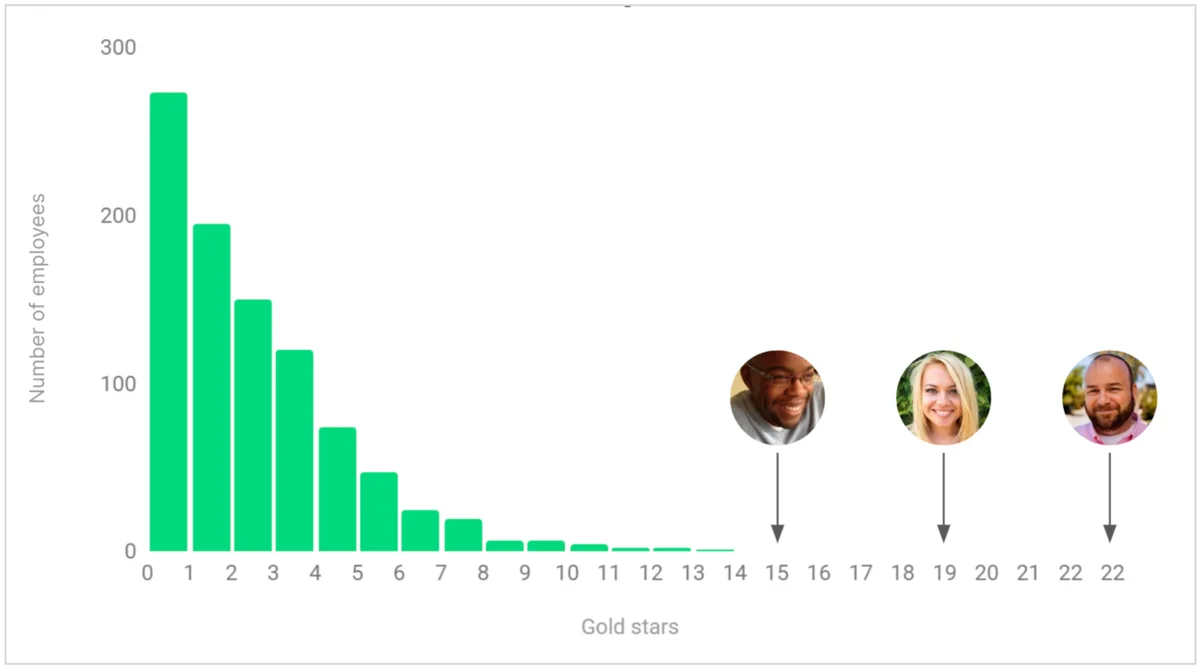
Why is this? Because work today isn’t solitary or repetitive, it’s creative and team-driven. There’s a lot of variability in how employees plan a marketing campaign or design a new software feature.
That means we’re not measuring additive variables anymore, but multiplicative ones. That’s why we have “10X” software engineers. Or account executives who 3X their quotas and find time to lift the rest of the team up too.
You can test this for yourself. Think of 8-10 people who you work with. My bet is that there are one or two of them who are so amazing, you wish you could clone them. That’s the power law of talent.
We’ve been thinking about talent the wrong way
Manager-driven performance reviews aren’t built for this new world of work. One reason is that 10X employees create a lot of their value by helping the people around them. Managers often lack the visibility to see this.
But here’s the bigger problem: the bell curve measures manager ratings, not actual performance.

By squashing the power law into a bell curve, we hide the true impact that top and bottom performers make. And we make many of our talent decisions with this misconception at the core.
That includes compensation, which under-rewards top performers and over-rewards bottom performers. Interestingly, in jobs where performance is both measured and transparent, compensation tends to follow a power law. That’s why a superstar like Stephen Curry makes approximately $59.6 million in the 2025-26 season (Basketball Reference, 2026), compared to the median NBA player who makes around $2 million.
- O'Boyle & Aguinis (2012), HBR: Analysis of 633,263 performers across entertainment, sports, politics, and academia found elite performers do NOT fit a bell curve — they follow a power law, with the top 5% producing 26% of total output.
- McKinsey Global Survey: Top performers in data-intensive jobs produce 800% more than average performers. In complex roles, the gap is even larger.
- Microsoft, GE, Accenture, Adobe: All abandoned forced-ranking/bell curve systems between 2013–2016, citing negative effects on collaboration, retention, and innovation.
How to Replace Bell Curves with Power Law Distribution in Your Organization
Understanding the problem is one thing. But how do you actually move away from bell curves and implement a performance management system that reflects power law distributions?
Step 1: Stop Forcing a Distribution
The first step is to acknowledge that your organization doesn't need—and probably doesn't want—a forced distribution. If your true data shows that 25% of your team are exceptional performers, that's okay. A forced distribution prevents you from seeing and rewarding this reality. Instead of using bell curves, let performance data tell its own story.
Step 2: Use Multiple Data Sources
Manager ratings alone won't reveal power law distributions. You need multiple perspectives: peer feedback, objective metrics, project outcomes, and network analysis. When employees collaborate across teams, their impact becomes visible through organizational network analysis (ONA). This shows who the connectors and amplifiers are—the people who make others more effective. These are often your power law performers.
Step 3: Run Proper Calibration Sessions
Calibration sessions should focus on consistency and fairness, not on fitting a predetermined curve. Bring managers together to discuss their ratings, compare notes on what "exceeding expectations" means in practice, and ensure accountability. The goal is to reduce bias and hidden assumptions, not to force a mathematical distribution.
Step 4: Reward Top Performers Like Superstars
Once you see your power law distribution, act on it. Your top 10-25% of performers drive disproportionate value. Compensation, promotions, flexibility, and opportunities should reflect this. You can't keep top talent if you compress their rewards to fit a bell curve. Use clear performance review conversations and language to communicate how top performers are valued. Treat your 10X employees like the superstars they are.
Step 5: Address Low Performers Directly (or Refer to Performance Improvement Plans)
A power law distribution often shows a clearer picture of bottom performers too. Rather than creating a "needs improvement" category to fill a curve quota, use this data to have real conversations. Some people need development; others may not be the right fit. Either way, you're making decisions based on data, not on how many slots you allocated to the bottom tier.
The companies winning the talent game have already made this shift. They're not constrained by bell curves. They see their talent for what it really is—a power law—and they're building compensation, promotion, and development strategies around that reality. It's not just fairer; it's more effective.
Maybe it’s time to start treating our 10X employees like the superstars that they are.
Ready to move beyond bell curves? See how Confirm's performance management approach helps you identify and develop talent based on actual performance patterns, not forced distributions.
- Talent follows a power law, not a bell curve — top performers in complex, creative roles produce 400–500% more value than average performers (O'Boyle & Aguinis, 2012, HBR).
- Bell curves measure manager ratings, not actual performance — forced distributions compress the true distribution and systematically under-reward top contributors.
- Forced ranking hurts retention — artificially capping 'exceeds expectations' ratings makes your best people feel undervalued, increasing flight risk.
- Modern work is multiplicative, not additive — collaborative, creative work amplifies individual impact beyond what solitary output measurement can capture.
- Calibration is the fix — replacing forced distributions with structured calibration sessions and multiple data sources (ONA, peer feedback, manager ratings) produces fairer, more accurate talent decisions.
- Reward your power law performers — compensation, promotions, and opportunities should reflect the asymmetric value top performers deliver, not fit a symmetric curve.
Frequently Asked Questions
Q: What is bell curve performance rating?
A: Bell curve performance rating (also called forced distribution or stack ranking) is a method where managers must distribute employee ratings to match a predetermined normal distribution — typically 10–20% rated high, 60–70% rated average, and 10–20% rated low. It was popularized at General Electric under Jack Welch. Critics argue it distorts true performance patterns, damages team culture, and systematically under-rewards top contributors.
Q: Why are bell curves bad for performance management?
A: Bell curves are problematic because talent in modern organizations follows a power law, not a normal distribution. Top performers in creative, collaborative roles produce 400–500% more value than average performers (O'Boyle & Aguinis, 2012). Forcing ratings into a bell curve hides this reality, under-rewards exceptional contributors, and creates internal competition that damages team effectiveness. Companies like Microsoft abandoned forced ranking after it hurt innovation and collaboration.
Q: What should replace bell curve performance ratings?
A: Most HR experts now recommend four alternatives to bell curve ratings:
- Calibration sessions — managers align on standards without forced distributions
- Multi-source feedback — peer, manager, self, and 360 input
- Organizational network analysis (ONA) — reveals actual influence and collaboration
- Clear criteria tied to business outcomes, not relative rank
Q: Does talent follow a power law or a bell curve?
A: Research shows talent in complex, knowledge-based roles follows a power law distribution — a small number of people create disproportionate value, while the majority cluster in the middle. O'Boyle and Aguinis (2012) analyzed over 600,000 researchers, entertainers, politicians, and athletes and found output followed a Paretian (power law) distribution rather than a Gaussian (normal) distribution.


